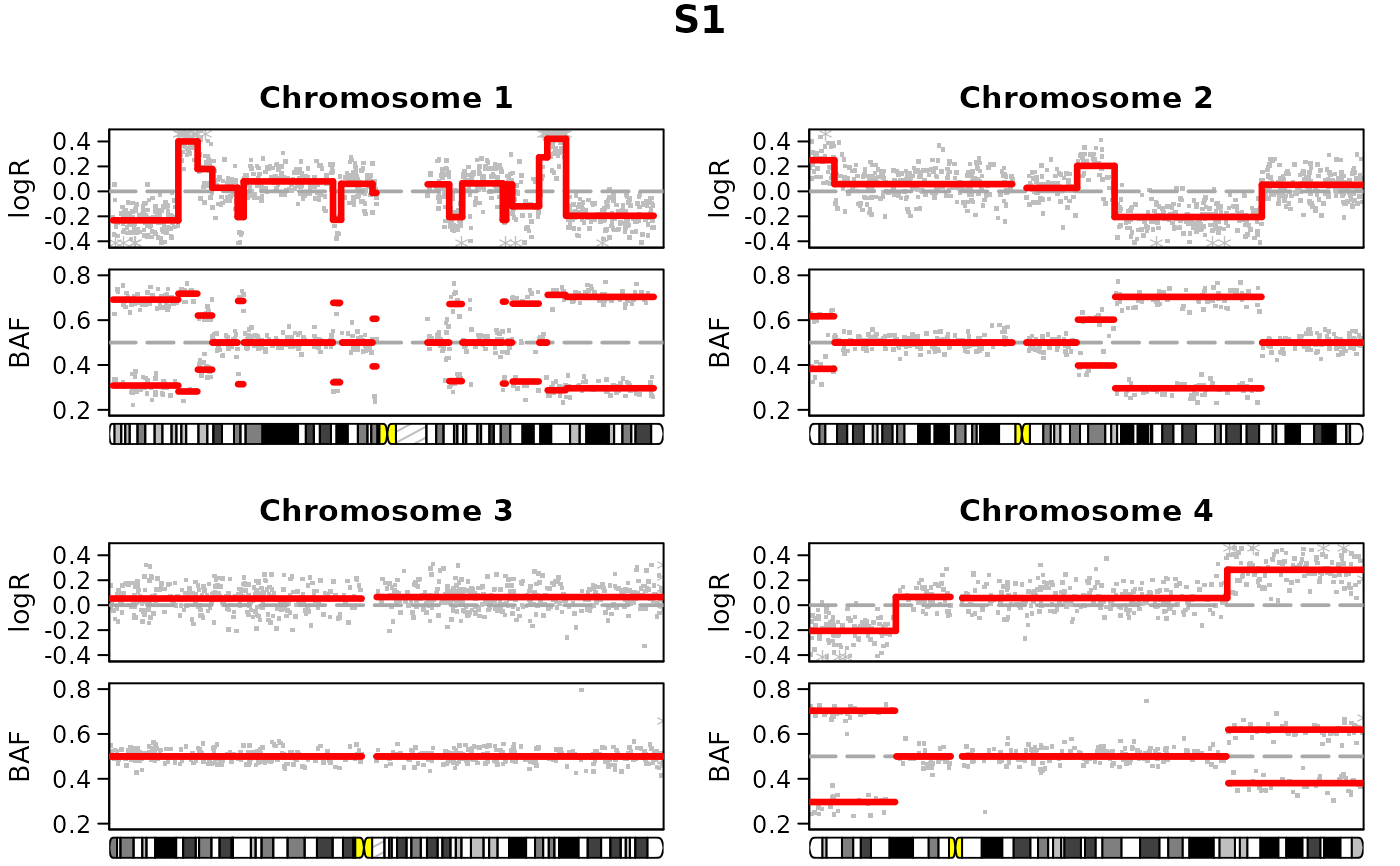
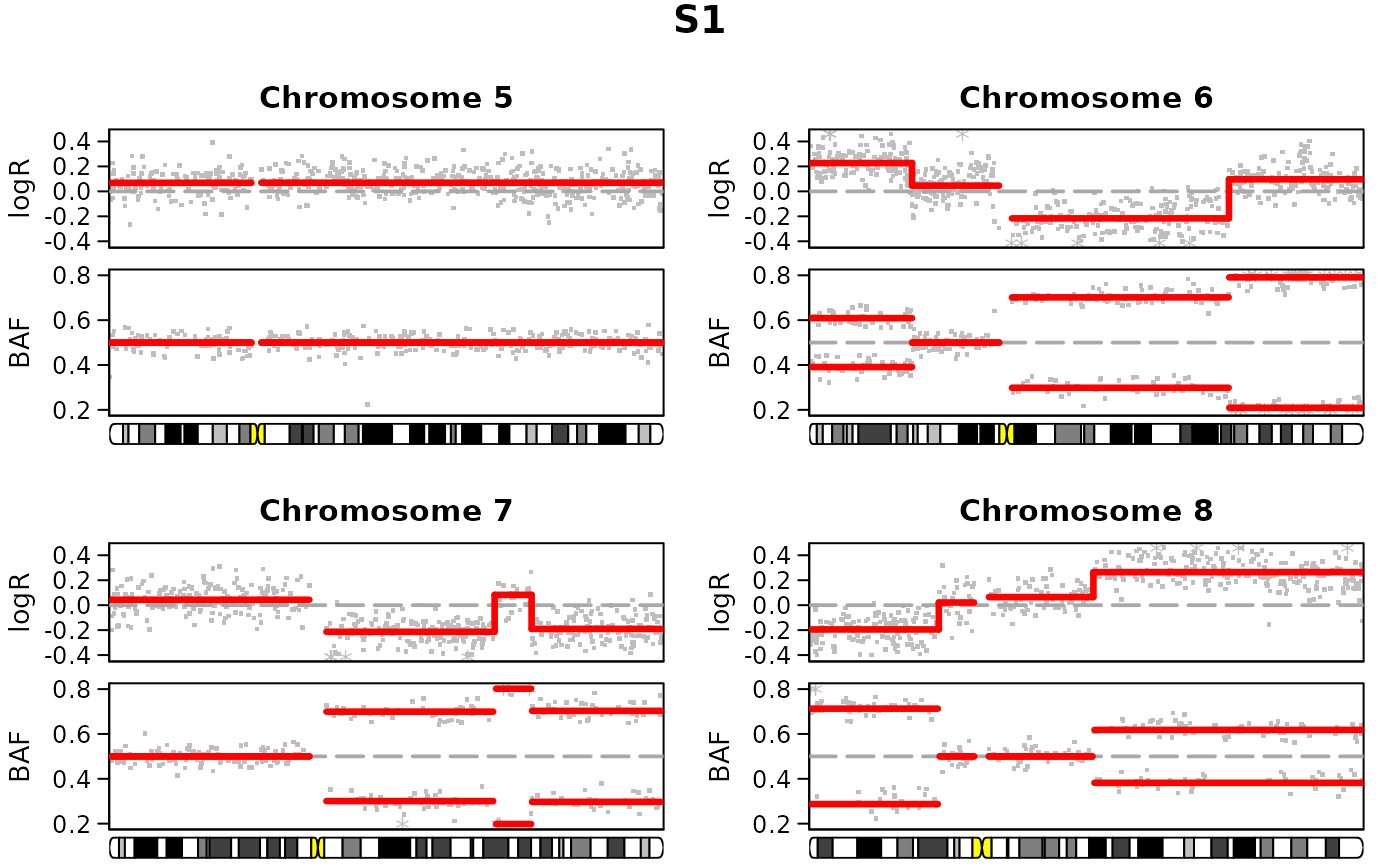
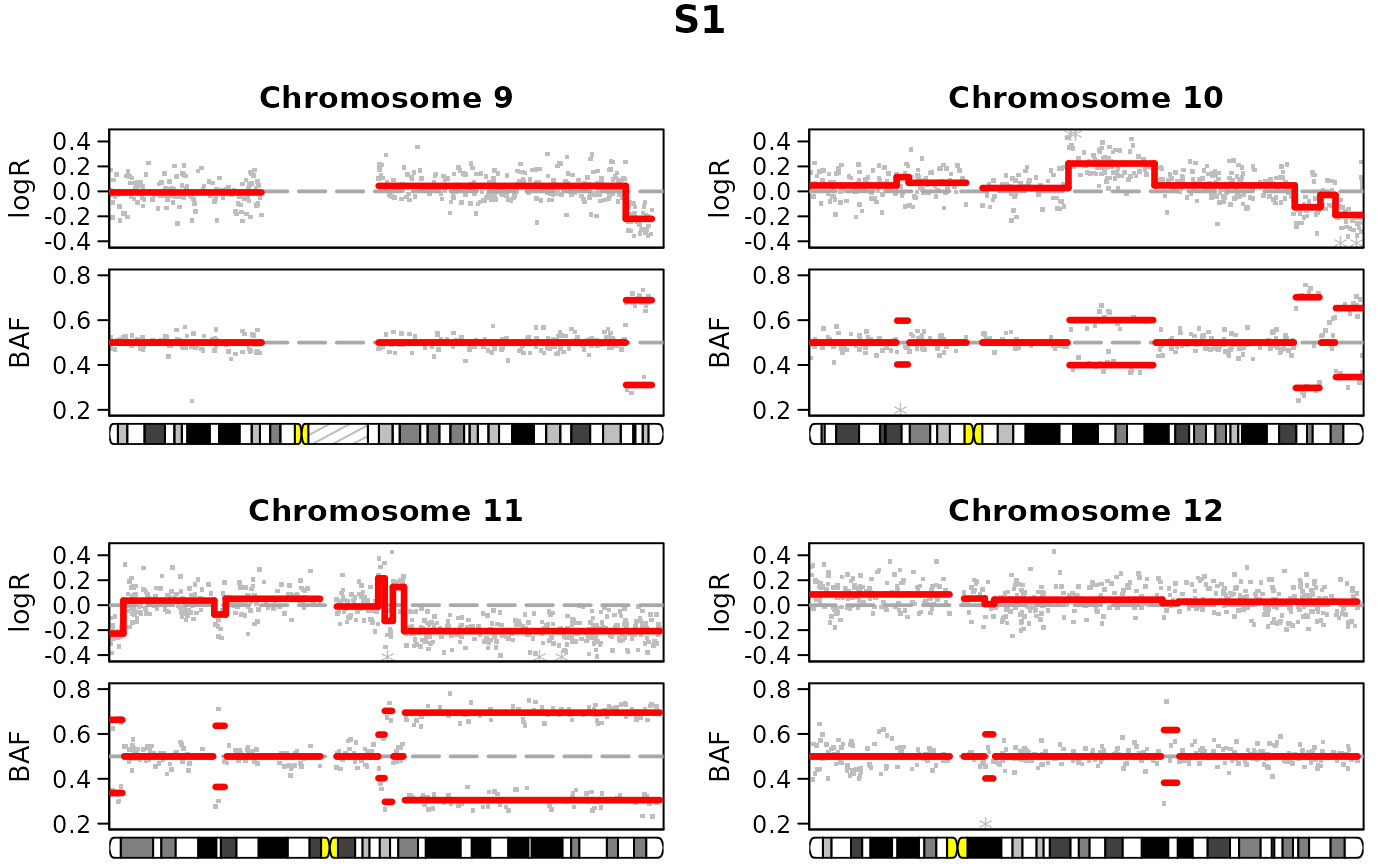
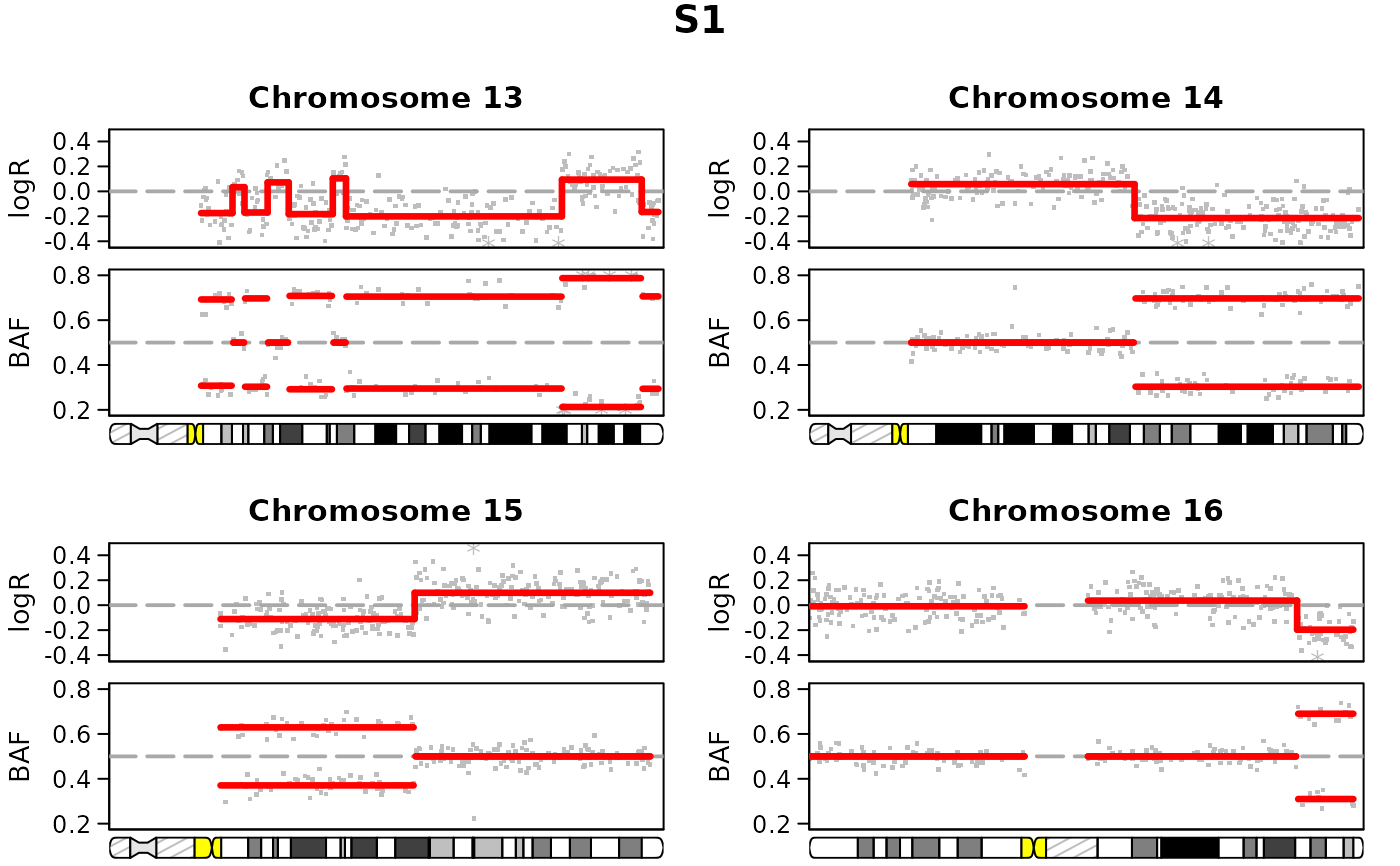
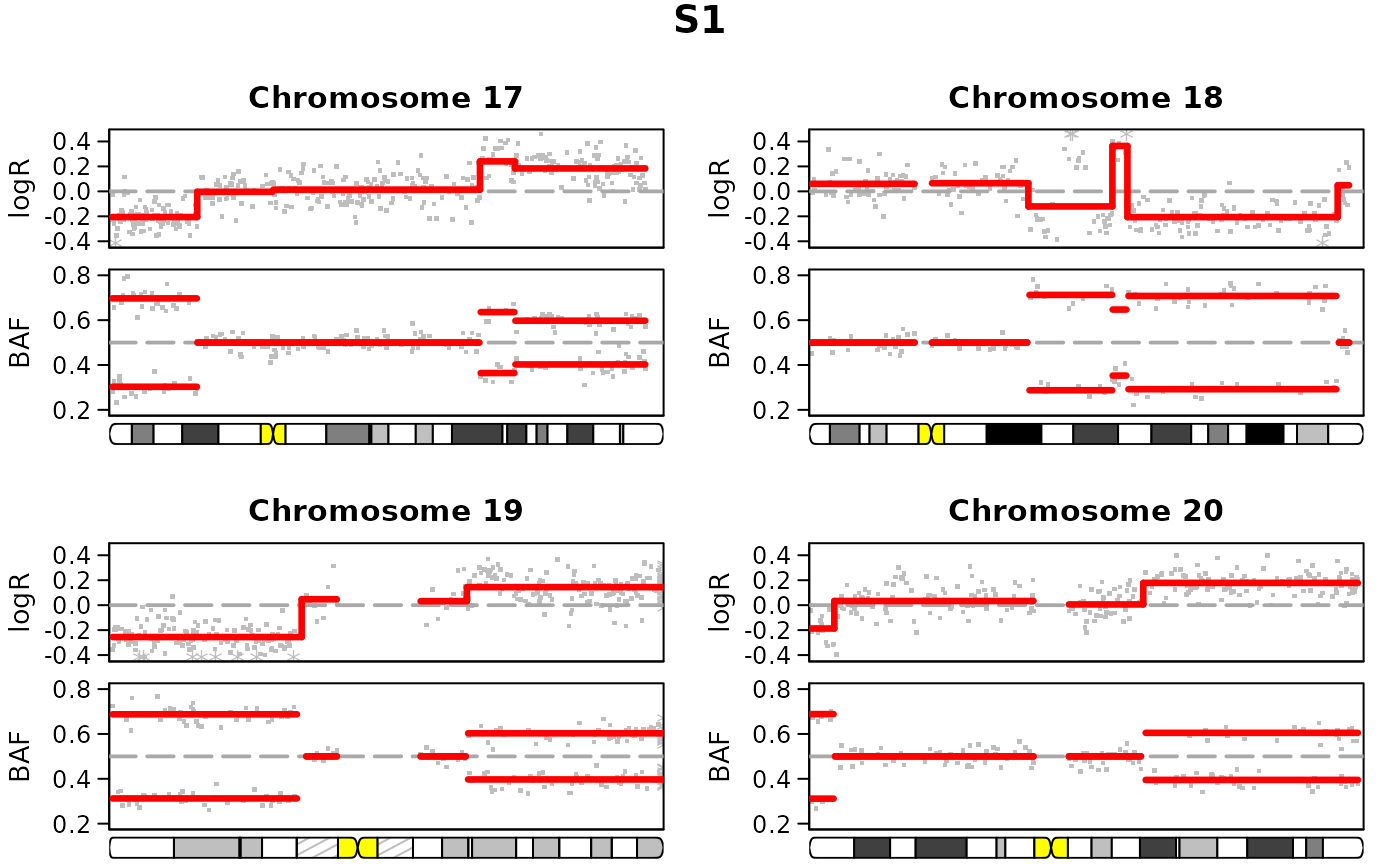
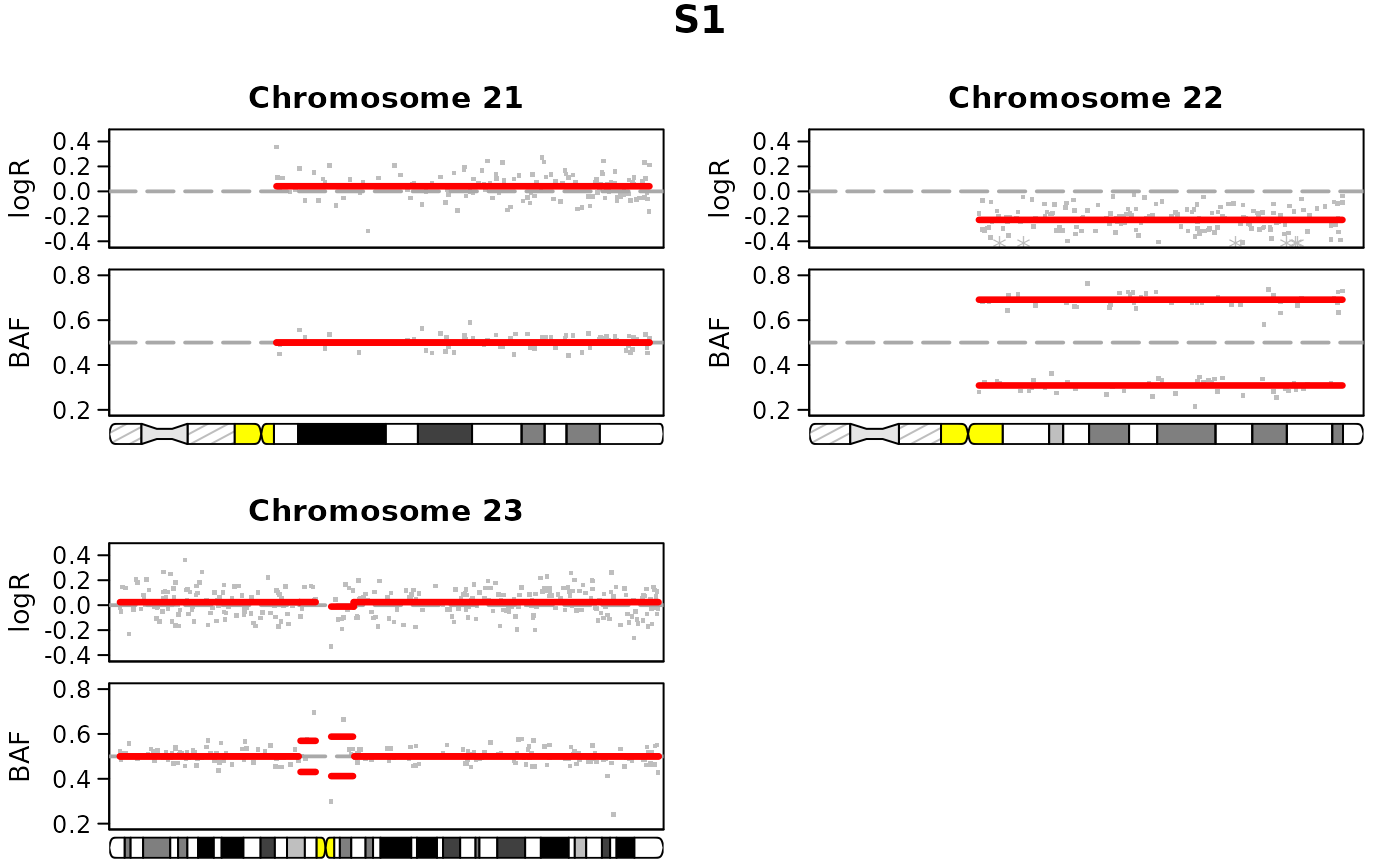
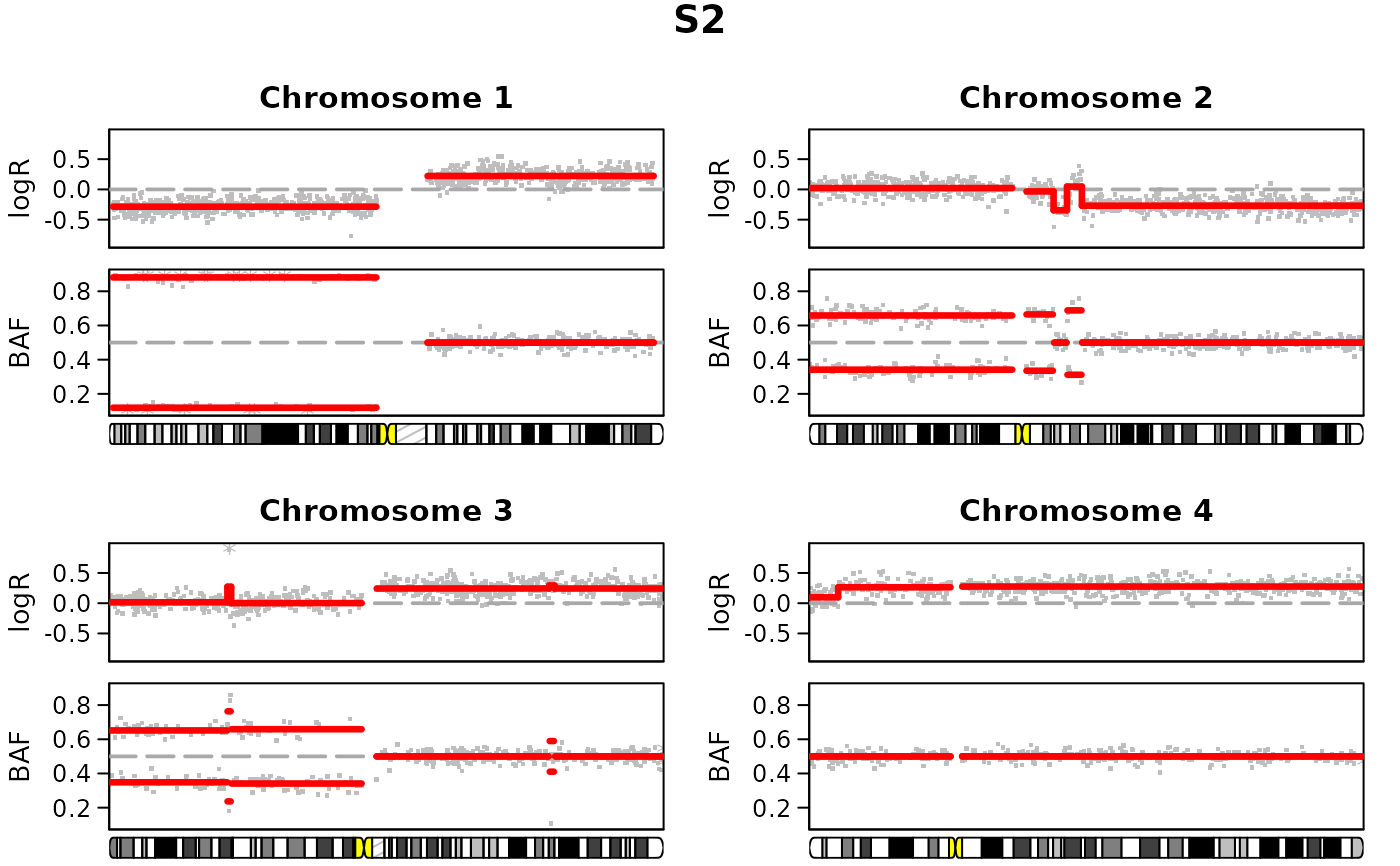
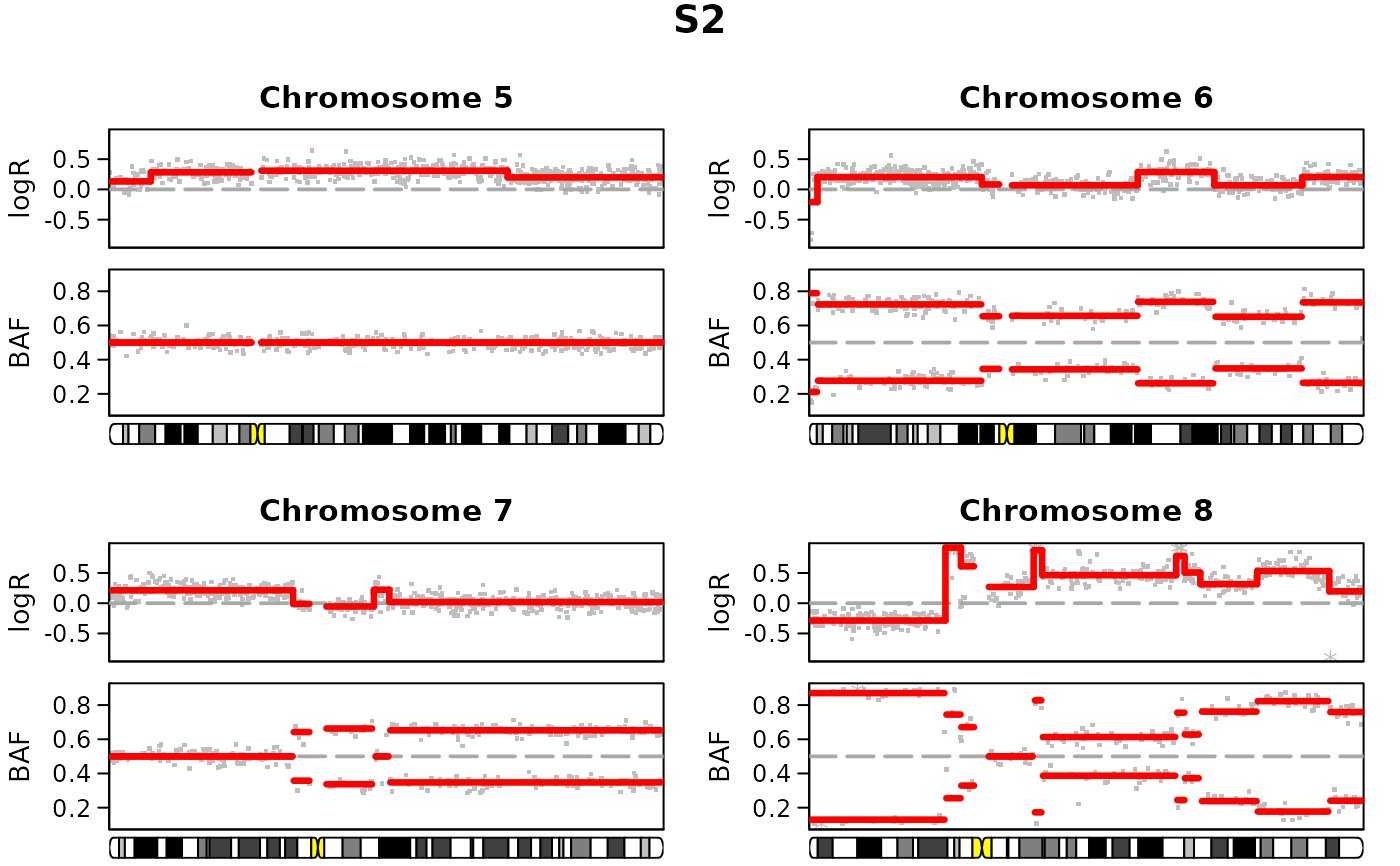
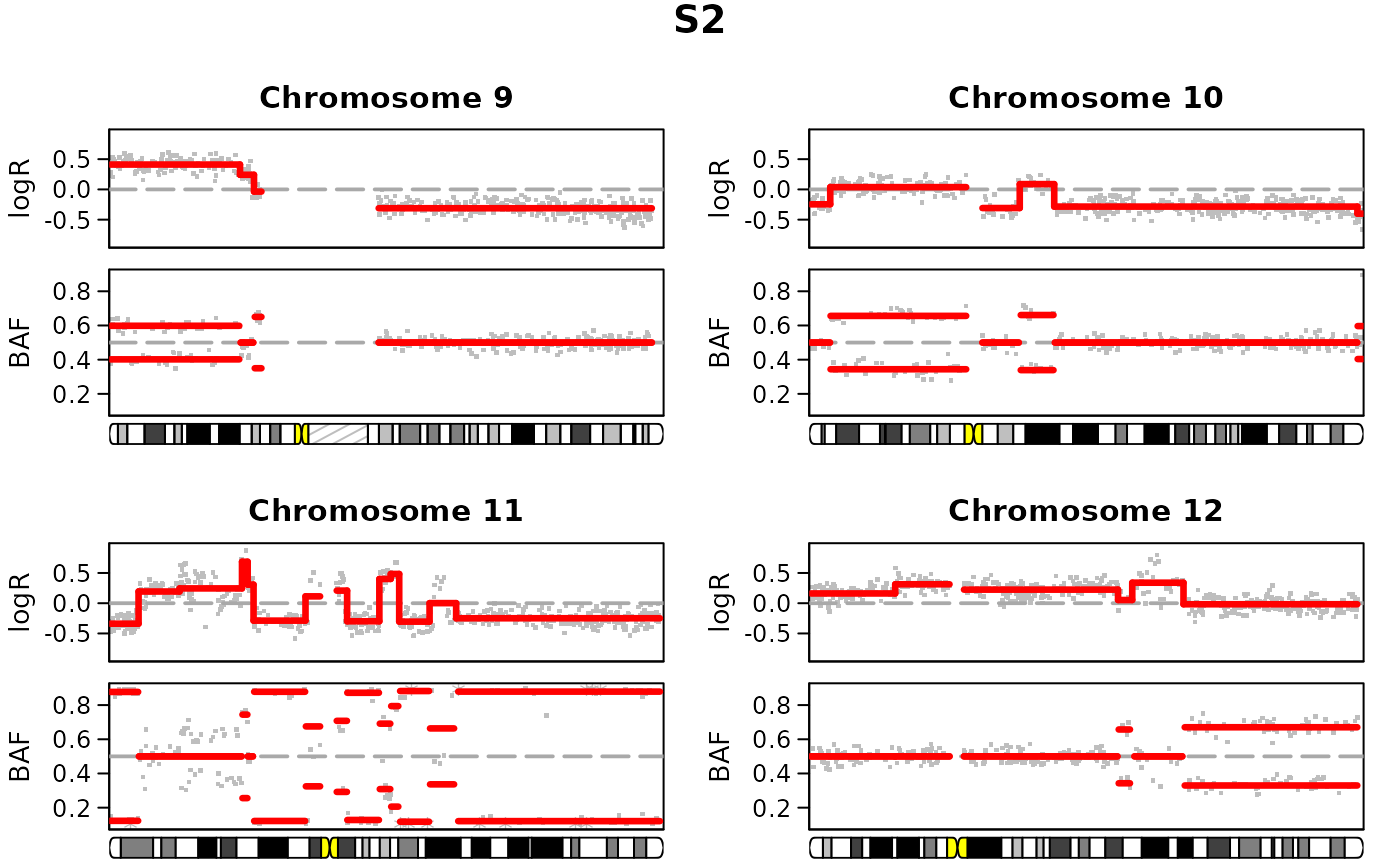
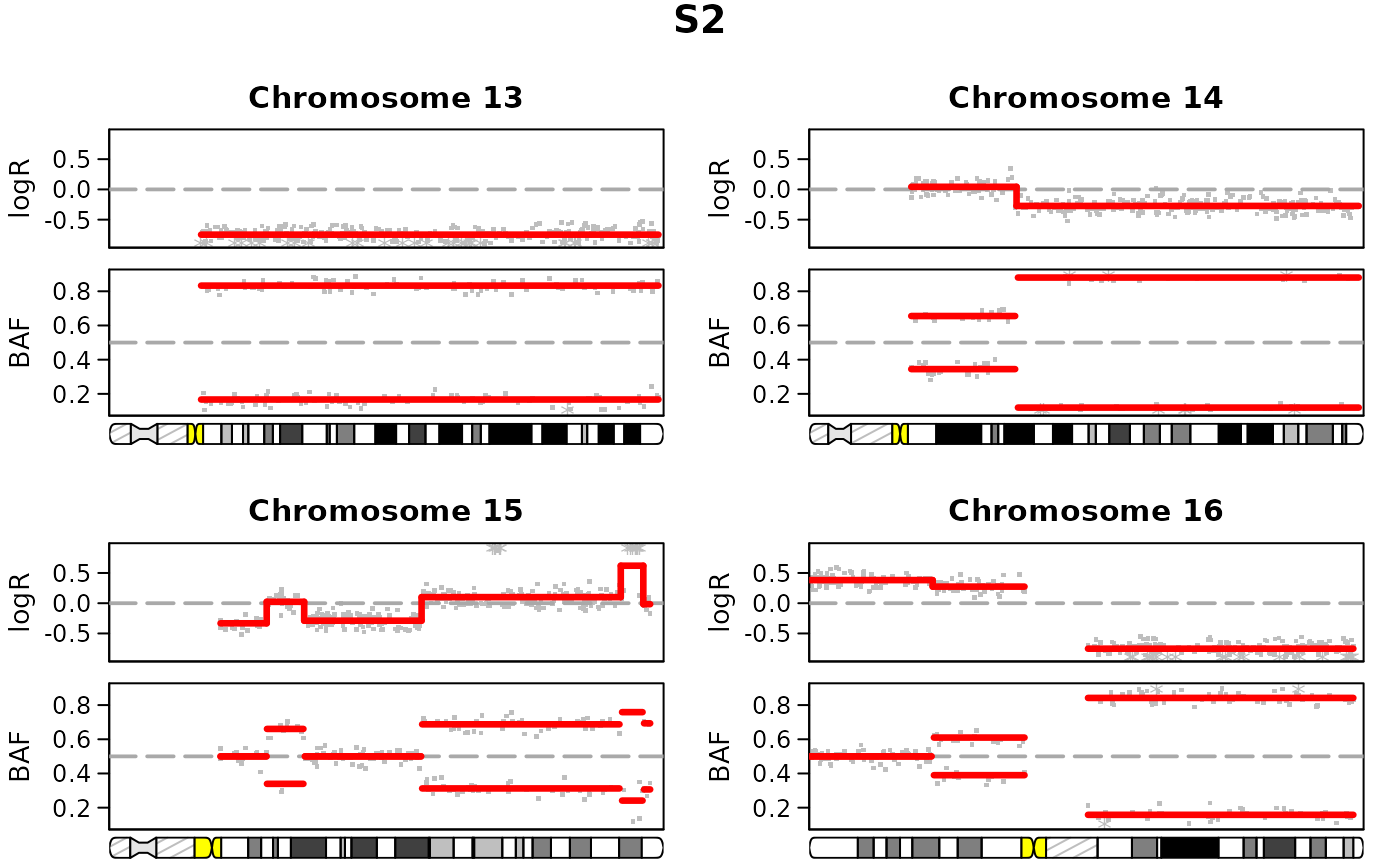
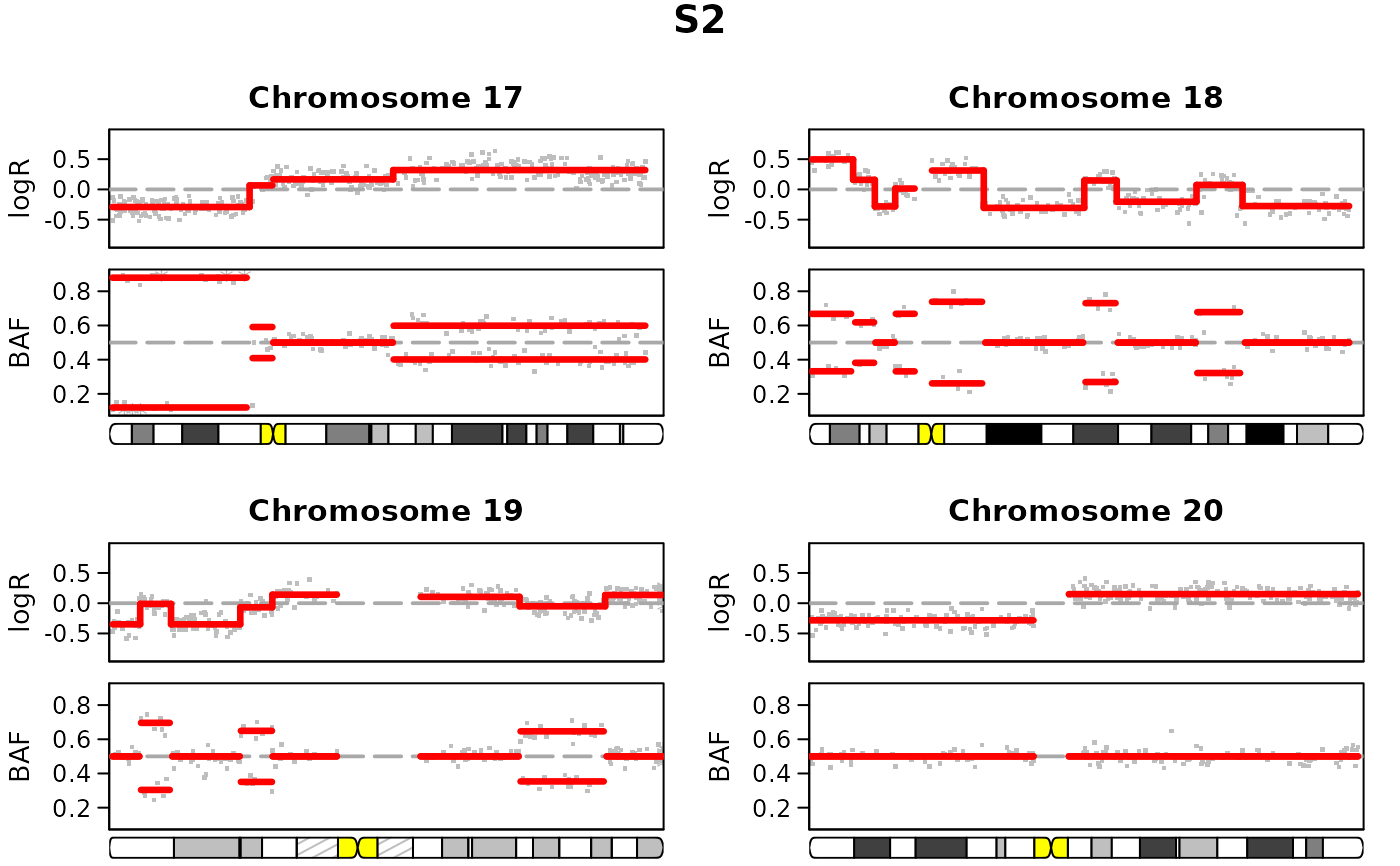
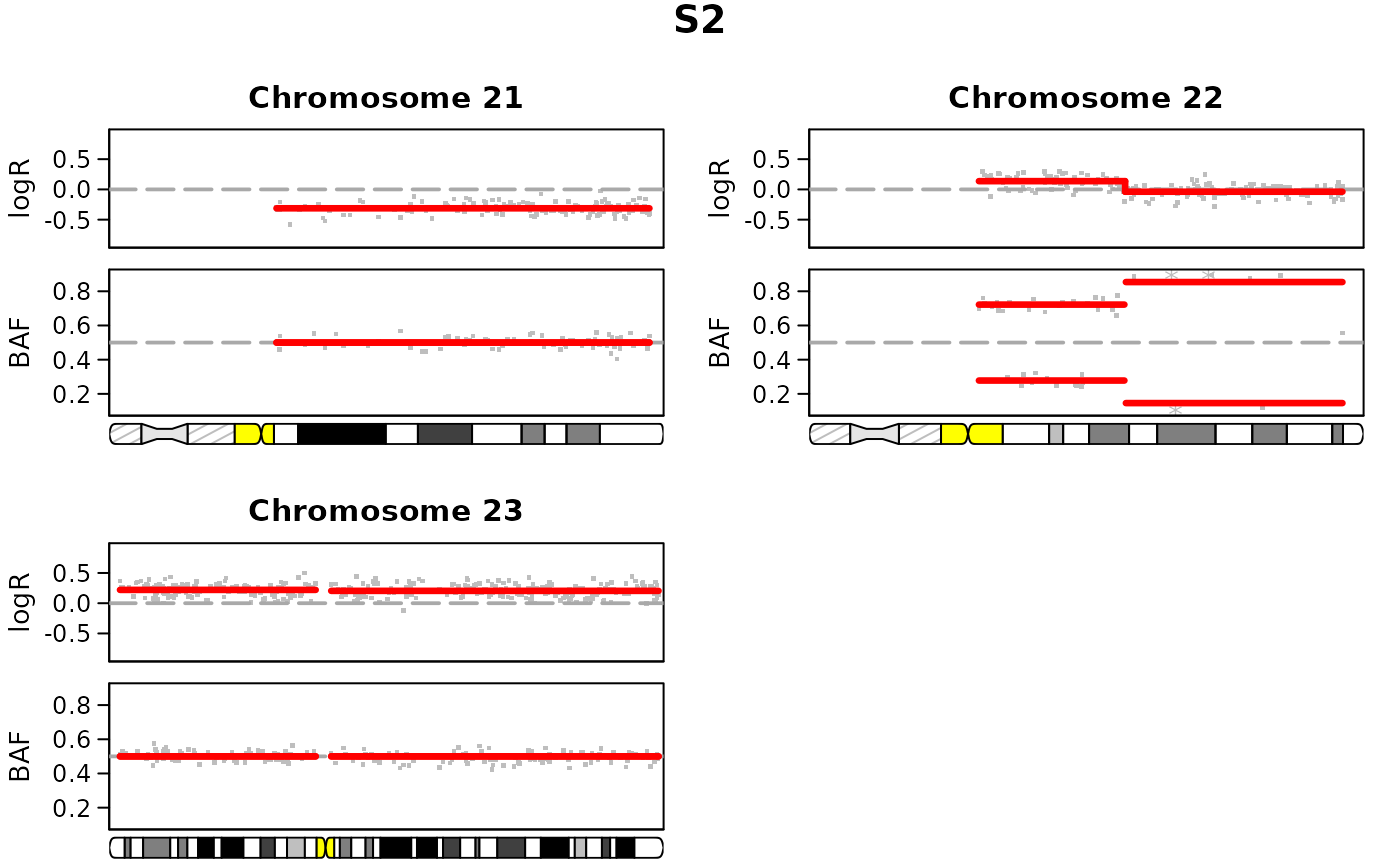
Plot bivariate SNP data and/or aspcf segmentation results for each sample separately with chromosomes in different panels
Arguments
- logR
a data frame with numeric or character chromosome numbers in the first column, numeric local probe positions in the second, and numeric copy number data for one or more samples in subsequent columns. The header of the copy number column(s) should give the sample IDss.
- BAF
a data frame on the same format and size as
logR, with chromosomes and local probe positions in the two first columns, and numeric BAF-measurements for one or more samples in subsequent columns.- segments
a data frame or a list of data frames containing the segmentation results found by
aspcf().- pos.unit
the unit used to represent the probe positions. Allowed options are "mbp" (mega base pairs), "kbp" (kilo base pairs) or "bp" (base pairs). By default assumed to be "bp".
- sample
a numeric vector indicating which sample(s) is (are) to be plotted. The number(s) should correspond to the sample's place (in order of appearance) in
logR, or insegmentsiflogRis unspecified.- chrom
a numeric or character vector with chromosome number(s) to indicate which chromosome(s) is (are) to be plotted.
- assembly
a string specifying which genome assembly version should be applied to define the chromosome ideogram.
- baf.thres
a numeric vector of length 2 giving thresholds below/above which BAF-values will not be plotted (use this to remove germline homozygous BAF probes from the plot).
- winsoutliers
an optional data frame of the same size as
logRidentifying observations classified as outliers bywinsorize(). If specified, outliers will be marked by a different color and symbol than the other observations (seewins.colandwins.pch).- xaxis
either "pos" or "index". The former implies that the xaxis will represent the genomic positions, whereas the latter implies that the xaxis will represent the probe indices. Default is "pos".
- layout
an integer vector of length two giving the number of rows and columns in the plot. Default is
c(1,1).- plot.ideo
a logical value indicating whether the chromosome ideogram should be plotted. Only applicable when
xaxis="pos".- ...
other graphical parameters. These include the common plot arguments
xlab,ylab,main,xlim,ylim,col(default is "grey"),pch(default is 46, equivalent to "."),cex,cex.lab,cex.main,cex.axis,las,tcl,marandmgp(seepar()on these). In addition, a range of graphical arguments specific for copy number plots may be specified, seeplotSample()on these.
Details
Several chromosome may be displayed on the same page with the layout
option. If the number of chromosomes exceeds the desired page layout, the
user is prompted before advancing to the next page of output.
Note
This function applies par(fig), and is therefore not compatible
with other setups for arranging multiple plots in one device such as
par(mfrow,mfcol).
Examples
#Load logR and BAF data:
data(logR)
data(BAF)

#Run aspcf::
aspcf.segments <- aspcf(logR,BAF)
#> aspcf finished for chromosome arm 1p
#> aspcf finished for chromosome arm 1q
#> aspcf finished for chromosome arm 2p
#> aspcf finished for chromosome arm 2q
#> aspcf finished for chromosome arm 3p
#> aspcf finished for chromosome arm 3q
#> aspcf finished for chromosome arm 4p
#> aspcf finished for chromosome arm 4q
#> aspcf finished for chromosome arm 5p
#> aspcf finished for chromosome arm 5q
#> aspcf finished for chromosome arm 6p
#> aspcf finished for chromosome arm 6q
#> aspcf finished for chromosome arm 7p
#> aspcf finished for chromosome arm 7q
#> aspcf finished for chromosome arm 8p
#> aspcf finished for chromosome arm 8q
#> aspcf finished for chromosome arm 9p
#> aspcf finished for chromosome arm 9q
#> aspcf finished for chromosome arm 10p
#> aspcf finished for chromosome arm 10q
#> aspcf finished for chromosome arm 11p
#> aspcf finished for chromosome arm 11q
#> aspcf finished for chromosome arm 12p
#> aspcf finished for chromosome arm 12q
#> aspcf finished for chromosome arm 13q
#> aspcf finished for chromosome arm 14q
#> aspcf finished for chromosome arm 15q
#> aspcf finished for chromosome arm 16p
#> aspcf finished for chromosome arm 16q
#> aspcf finished for chromosome arm 17p
#> aspcf finished for chromosome arm 17q
#> aspcf finished for chromosome arm 18p
#> aspcf finished for chromosome arm 18q
#> aspcf finished for chromosome arm 19p
#> aspcf finished for chromosome arm 19q
#> aspcf finished for chromosome arm 20p
#> aspcf finished for chromosome arm 20q
#> aspcf finished for chromosome arm 21q
#> aspcf finished for chromosome arm 22q
#> aspcf finished for chromosome arm Xp
#> aspcf finished for chromosome arm Xq

#Plot
plotAllele(logR,BAF,aspcf.segments,layout=c(2,2))