Heatmap reflecting the magnitude of estimated copy numbers relative to some
pre-defined limits. Estimates may be obtained using pcf or
multipcf, and results may be visualized over the entire genome or by
chromosomes.
Usage
plotHeatmap(
  segments,
  upper.lim,
  lower.lim = -upper.lim,
  pos.unit = "bp",
  chrom = NULL,
  layout = c(1, 1),
  ...
)
Arguments
- segments
a data frame containing the segmentation results found by either
pcf()ormultipcf().- upper.lim
a positive numeric vector giving the upper limits(s) to be applied. The colors in the heatmap will reflect the magnitude of the estimated copy numbers relative to this limit, see details.
- lower.lim
a negative numeric vector of same length as
upper.limgiving the lower limits(s) to be applied. Default is to use the negative value ofupper.lim.- pos.unit
the unit used to represent the probe positions. Allowed options are "mbp" (mega base pairs), "kbp" (kilo base pairs) or "bp" (base pairs). By default assumed to be "bp".
- chrom
a numeric or character vector with chromosome number(s) to indicate which chromosome(s) is (are) to be plotted. If unspecified the whole genome is plotted.
- layout
the vector of length two giving the number of rows and columns in the plot window. Default is
c(1,1).- ...
other optional graphical parameters. These include the plot arguments
xlab,ylab,main,cex.main,mgp,cex.lab,cex.axis,marandtitle(seepar()on these), as well asplot.size,plot.unit,plot.ideo,ideo.frac,cyto.text,assemblyandcex.cytotext(seeplotSample()on these). In addition, a range of graphical arguments specific for this plot function may be specified:colorsa character vector of length three giving the colors to interpolate in the heatmap, default is c("dodgerblue","black","red").
n.colan integer giving the number of color shades to be applied in the interpolation, default is 50.
sample.labelsa logical value indicating whether sample labels are to be plotted along the y-axis. Default is TRUE.
sep.samplesa number in the range 0 to 0.4 used to create some space between samples. Default is 0, which implies that there is no space.
sample.linea numeric scalar giving the margin line where the sample labels should be written, starting at 0 counting outwards. Default is 0.2.
sample.cexthe size of the sample labels.
Details
For each sample, the segments are represented by a rectangle plotted in a
color corresponding to the difference between the segment copy number value
and the limits. If the value is below lower.lim, the color of the
rectangle will equal the input in colors[1] (default dodgerblue). If
the value is above lower.lim, but below zero, the color of the
rectangle will be a nuance between the input in colors[1] and
colors[2] (default black). The closer the value is to zero, the
closer the nuance will be to colors[2]. Similary, if the value is
above upper.lim, the color of the rectangle will equal the input in
colors[3] (default red), whereas if the value is below
upper.lim, but above zero, the color will be a nuance between the
input in colors[2] and colors[3]. Again, the closer the value
is to zero, the closer the nuance will be to colors[2].
Each row in the heatmap represents a sample, while probe positions are reflected along the x-axis.
Note
This function applies par(fig), and is therefore not compatible
with other setups for arranging multiple plots in one device such as
par(mfrow,mfcol).
Examples
#Load lymphoma data
data(lymphoma)
#Run pcf to obtain estimated copy number values
seg <- pcf(data=lymphoma,gamma=12)
#> pcf finished for chromosome arm 1p
#> pcf finished for chromosome arm 1q
#> pcf finished for chromosome arm 2p
#> pcf finished for chromosome arm 2q
#> pcf finished for chromosome arm 3p
#> pcf finished for chromosome arm 3q
#> pcf finished for chromosome arm 4p
#> pcf finished for chromosome arm 4q
#> pcf finished for chromosome arm 5p
#> pcf finished for chromosome arm 5q
#> pcf finished for chromosome arm 6p
#> pcf finished for chromosome arm 6q
#> pcf finished for chromosome arm 7p
#> pcf finished for chromosome arm 7q
#> pcf finished for chromosome arm 8p
#> pcf finished for chromosome arm 8q
#> pcf finished for chromosome arm 9p
#> pcf finished for chromosome arm 9q
#> pcf finished for chromosome arm 10p
#> pcf finished for chromosome arm 10q
#> pcf finished for chromosome arm 11p
#> pcf finished for chromosome arm 11q
#> pcf finished for chromosome arm 12p
#> pcf finished for chromosome arm 12q
#> pcf finished for chromosome arm 13q
#> pcf finished for chromosome arm 14q
#> pcf finished for chromosome arm 15q
#> pcf finished for chromosome arm 16p
#> pcf finished for chromosome arm 16q
#> pcf finished for chromosome arm 17p
#> pcf finished for chromosome arm 17q
#> pcf finished for chromosome arm 18p
#> pcf finished for chromosome arm 18q
#> pcf finished for chromosome arm 19p
#> pcf finished for chromosome arm 19q
#> pcf finished for chromosome arm 20p
#> pcf finished for chromosome arm 20q
#> pcf finished for chromosome arm 21q
#> pcf finished for chromosome arm 22q
#> pcf finished for chromosome arm 23p
#> pcf finished for chromosome arm 23q
#Heatmap for entire genome, two limit values:
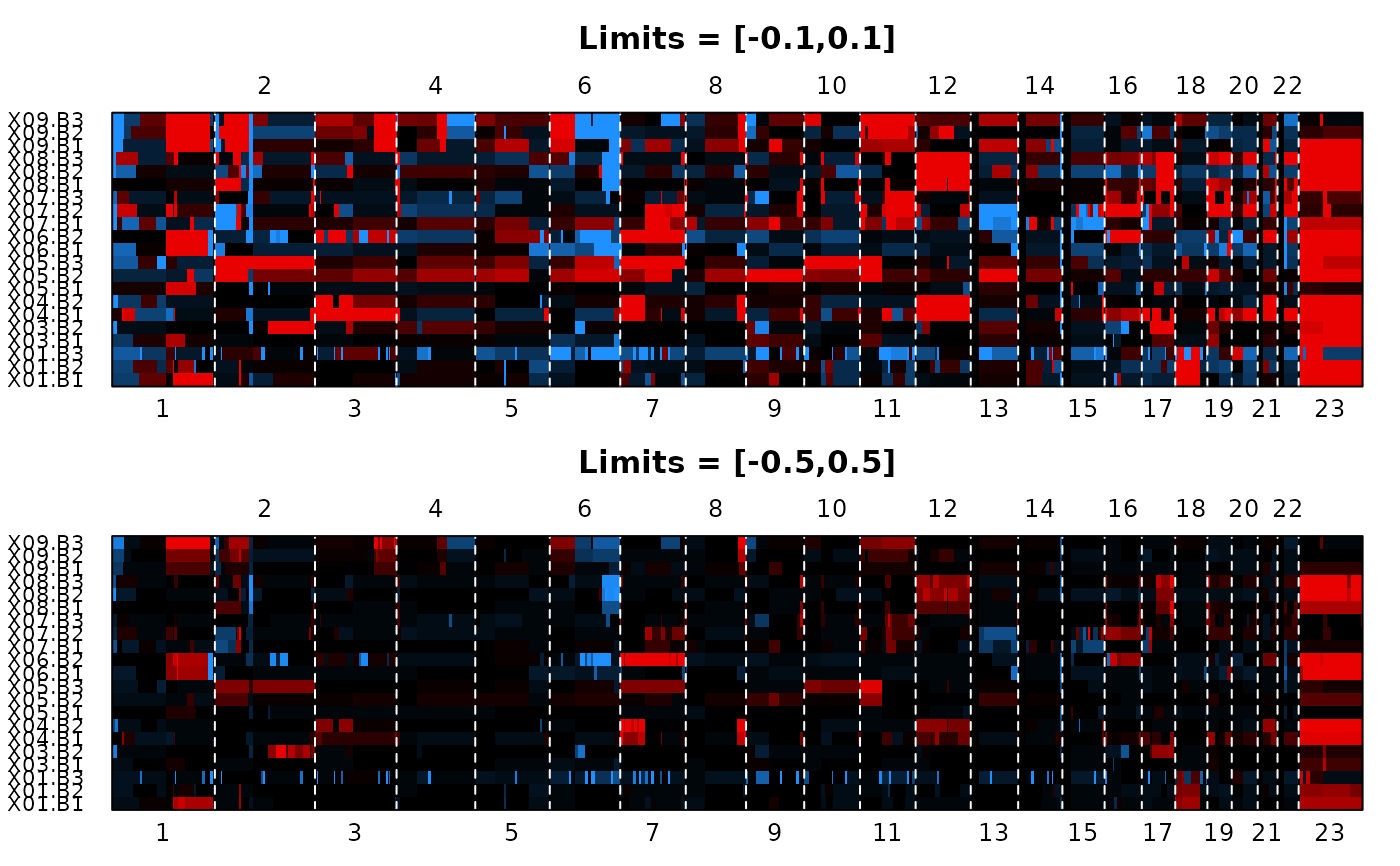
plotHeatmap(segments=seg,upper.lim=c(0.1,0.5),layout=c(2,1))
 #Heatmap for the first 4 chromosomes:
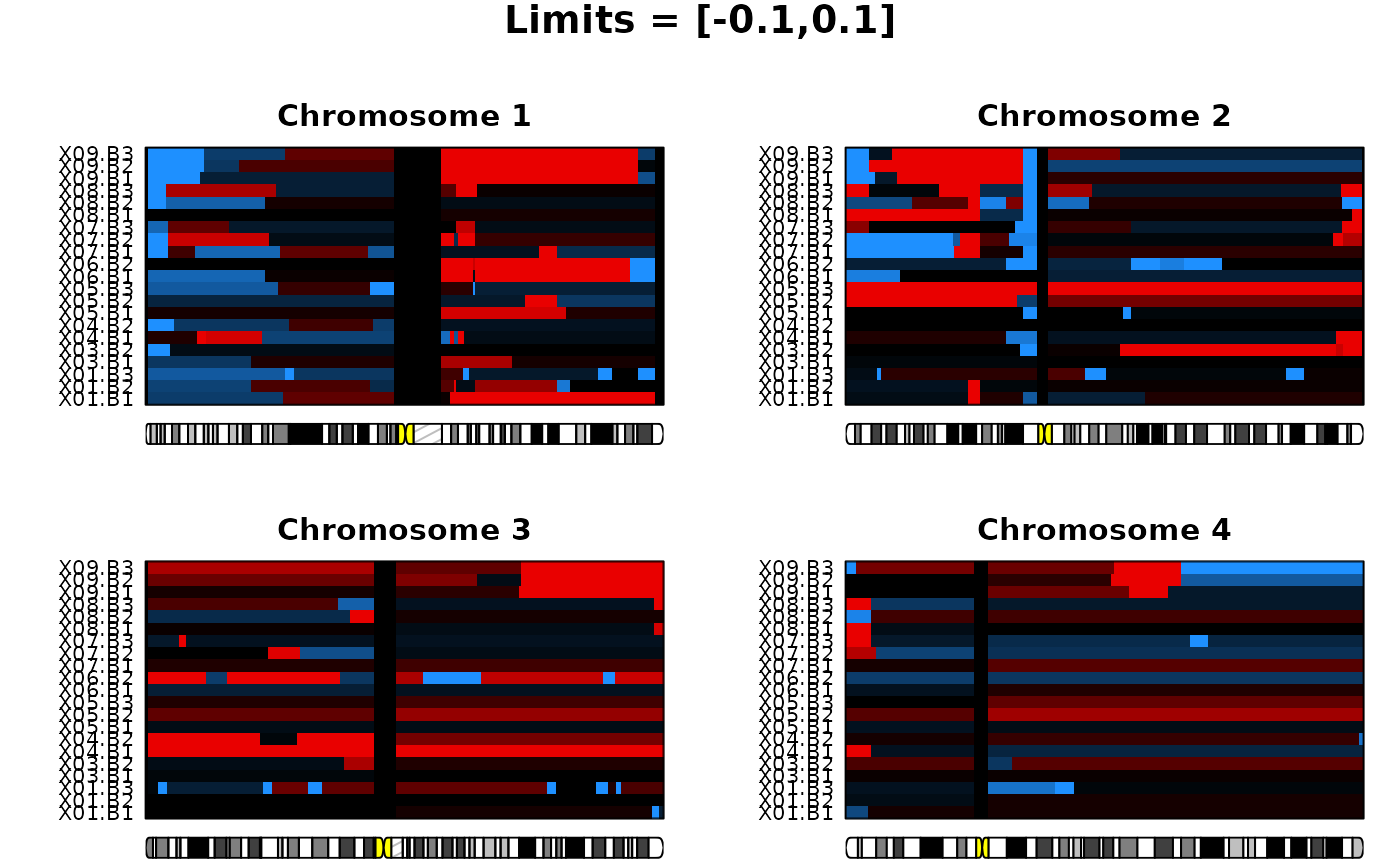
plotHeatmap(segments=seg,upper.lim=0.1,chrom=c(1:4),layout=c(2,2))
#Heatmap for the first 4 chromosomes:
plotHeatmap(segments=seg,upper.lim=0.1,chrom=c(1:4),layout=c(2,2))